Understanding your competitors’ content strategies is crucial, whether you’re running a comprehensive SEO campaign or focused on semantic SEO.
I’ve developed a free Python script to analyze your competitors’ publishing frequency. It leverages sitemap data to reveal how often your competitors publish new – or update existing – content pieces.
This insight is crucial as Google weighs your publishing velocity when assessing your topical authority. This user-friendly tool eliminates guesswork from your content planning by providing a data-driven approach.
Determining the right amount of content is crucial for SEO success, and this script helps you refine your strategy based on data. Here’s how.

Why understanding your competitors’ content publishing practices matters in semantic SEO
Let’s start with a quick refresher on why publishing velocity matters. After that, I’ll guide you through the practical use of this script.
Content velocity
This concept is straightforward: regular publication of relevant, high-quality content on a topic suggests to Google that the site is a current and authoritative source in that area.
Understanding content velocity is essential for any website looking to establish itself as an authority in its field.
Finding micro pockets of content to develop topical authority
Topical authority is a relative concept, as we discussed previously.
Google employs advanced machine learning techniques to:
- Accurately distinguish where one topic ends and another begins.
- Identify the boundaries of related subtopics.
They can then use these boundaries to understand which sites are authorities on given topics.
This sophisticated process means that using techniques like graphing language through vectors, Google can distribute topical authority to sites in sub-niches of subjects, not just broad subject matters.
As a content creator, this means it’s more feasible to establish authority in niche segments (i.e., “basketball free throws”) than in broad areas where you’re competing against established giants (i.e., “basketball”). Analyzing competitor sitemaps can unveil content gaps and opportunities in these micro-niches.
Later, I will demonstrate how to use the script to filter sitemaps for specific keywords, identifying content velocity in targeted areas.
Understand the widening gap between you and your competitors
Understanding your competitors’ content investment is crucial beyond the scope of semantic SEO.
If competitors heavily invest in SEO and outperform your site, it can be a benchmark for the effort and resources you might need to stay competitive.
Self-analyzing
Analyzing your own website’s sitemap using the same tool can be revealing. By correlating post timings with traffic data, you can uncover the topics Google deems your site authoritative in.
Historically, tracking how long it takes for newly published content to begin ranking in Google is via Google Search Console or tools like Ahrefs.
Two other things that can be done with the Python script include:
Quick traffic analysis using the Python script below
- Utilizing Google Colab or running the Python script locally allows you to combine your sitemap and publish dates with traffic data from tools like Ahrefs.
- This can reveal which recently updated posts are gaining traction, guiding you toward topics resonating with your audience and search engines.
- This targeted approach to content development can significantly enhance your SEO efforts.
Identify pages that haven’t been updated in a long time
- Every strong site updates its top-performing pages to make them better for users.
- One of the benefits of analyzing your sitemap is quickly seeing which posts have traffic but haven’t been updated in a long time.
While this list is far from exhaustive, now that we’ve summarized why understanding publishing frequencies is important, let’s start using this Python script.
Running the Python script
Access the script by clicking this link: Posting_Analysis.ipynb
Note: No prior knowledge of Python or its packages is necessary to run scripts on Google Colab, as it provides a virtual machine environment for code sharing and execution.
Step 1: Find and upload the sitemaps
I’ll be using our company’s URL in this demonstration.
This script is compatible with any XML sitemap, but for most WordPress websites, you can locate the sitemap by adding “sitemap.xml” to the end of the URL.
If that doesn’t work, I recommend using Google’s site operator search:
- site:example.com sitemap
This will likely reveal the XML sitemap.

WordPress
WordPress organizes sitemaps by Pages and Posts by default. If your site has been customized with additional categories, they will also appear in this main view.

Copy and paste each sitemap into the Python list, enclosing each entry in quotes and separating them with commas. You can add as many sitemaps as needed for analysis.
Note: Large websites may compress their sitemaps into .tgz ZIP files. Sitemaps have a limit of 50,000 URLs. Analyzing a large website will be more time-consuming, as you must manually extract each sitemap. This script is not designed to handle such sites.
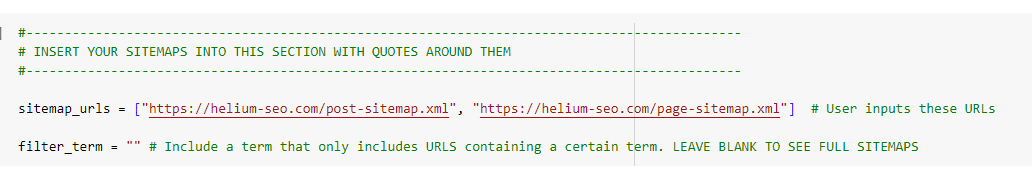
Click the play icon to execute the code and store the sitemaps in memory for further processing. We’ll revisit the filter_term field later, as it’s an optional parameter for selective analysis.
Step 2: Upload Ahrefs traffic data (optional)
This optional step requires an active Ahrefs account. It allows us to enrich our sitemap data with traffic and top-ranking keyword information.
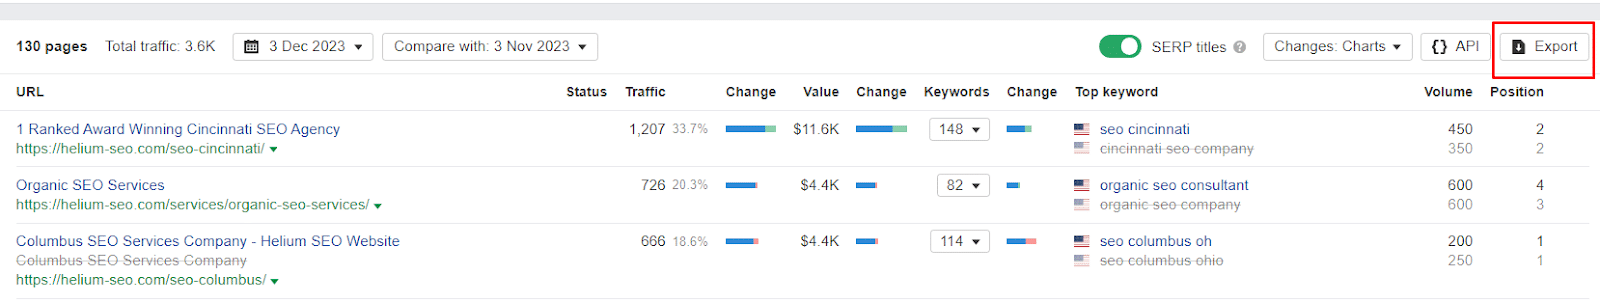
To do this, navigate to your domain in Ahrefs Site Explorer and then access the Top Pages section.
Next, click Export.
I’ve customized the script to work with different encoding options. However, the preference is to select UTF-8.

Proceed by clicking the run icon and uploading the recently downloaded file. Locate the upload file box at the bottom of the page and upload it if you have it. Alternatively, you can skip this step.
Once the file is uploaded, the script will process the data.
Note that if you’re analyzing multiple competitor sitemaps, you can append each competitor’s Top Pages report to the bottom of the CSV file you intend to upload.
This will allow the script to match each sitemap to its corresponding traffic data.
Step 3: Run the script
If you incorporated Ahrefs data, your analysis should already be complete.
However, if you skipped the data upload step, click Cancel upload instead of uploading a file when you click the play icon. The script will then execute and present your analysis.
Step 4: Analyze the results
The analysis provides valuable insights into competitor strategies.
Years of SEO experience have shown that keyword strategy, publishing frequency and link acquisition are impactful parameters for successful SEO.
While tools like Ahrefs help identify keywords and backlinks, they may not provide comprehensive insights into competitor posting frequencies or guide content publishing decisions.
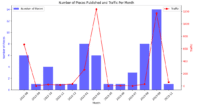
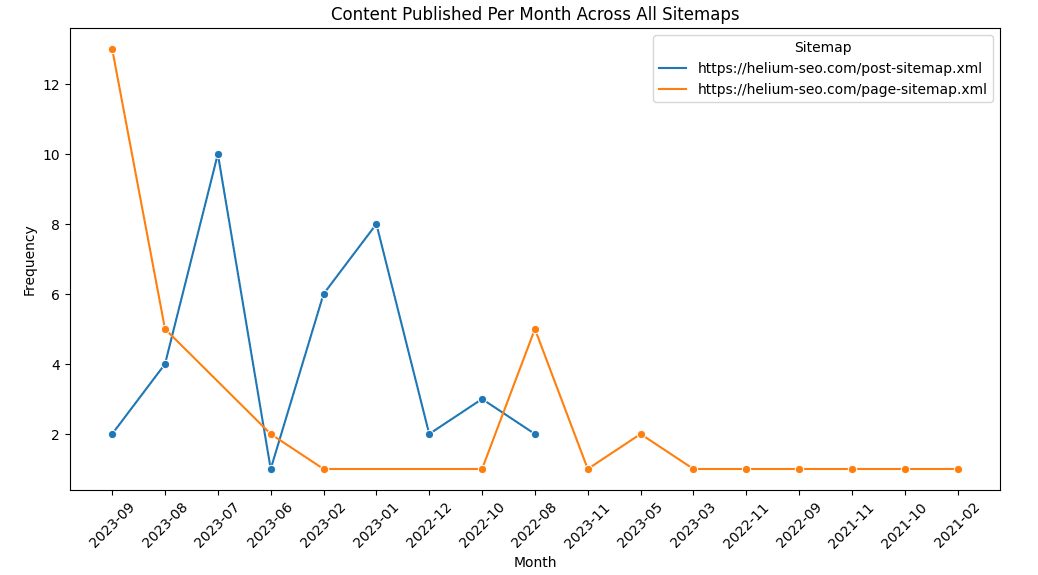
First, examine the content types and publishing frequencies of your competitors. The initial graphs provide a good indication of the frequency with which competitors publish new content.
For WordPress sites considering both posts and pages, it is recommended to differentiate between money and informational pages. (However, site structures vary; reviewing sitemaps can help identify the specific page types.)
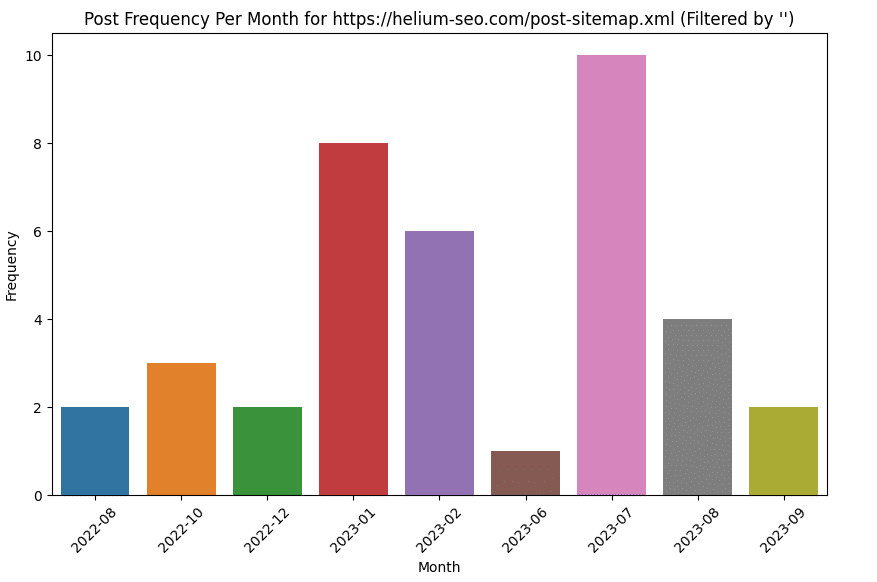
Note: You’ll see an average calculation at the bottom of each chart.

I’ve added an extra view that lets you compare your site to competitors or view a group of competitor sitemaps simultaneously. This simplifies site comparison and competitor analysis.
Analyze the effectiveness of recently updated pages and traffic
Leveraging Search Console queries to identify topics perceived as relevant by Google has been a common practice among affiliates and SEOs.
As topical authority in a broad or niche category is established, newly published content tends to gain traction quickly.
This report provides insights into your competitors’ content performance from Google’s perspective. If you observe recently edited content (often newly published) with significant traffic, your competitor is in a phase where Google recognizes its authority on the published content.
By overlaying traffic data over publishing frequency, you can swiftly assess the effectiveness of newly published content compared to older content.

Diving into specifics
This high-level overview can guide your attention toward strategies that may be effective for competitors or your website.
However, such high-level views can sometimes be skewed by outliers or anomalies that only become apparent upon deeper data analysis.
The final chart can be exported to a CSV file, enabling you to delve deeper into the nuances of the report.
To view all the data, click the following:
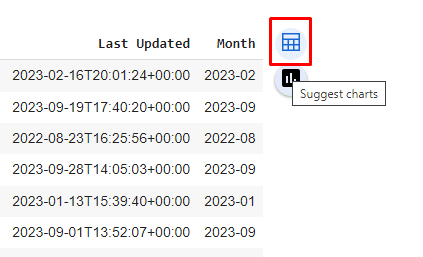
Export data by clicking:

Additional uses
Website utility
- This data serves as a valuable tool for monitoring your SEO efforts. You can verify that your SEO provider or writing team consistently updates critical pages and publishes fresh content.
Competitor insights
- Gain insights into how frequently your competitors update key content pieces.
- For instance, if a competitor outranks you for a crucial keyword, monitoring their content update frequency can reveal how actively they are enhancing it.
- This information can guide your decision-making regarding the balance between maintaining and improving existing content versus creating new content.

Step 5: Use ‘contains keyword’ to understand the content velocity of specific subjects on the website
This final aspect aligns with the semantic SEO concepts discussed in previous articles.
Identifying areas where competitors have inadequate coverage can be advantageous when developing a content strategy.
Targeting these underserved subtopics increases your chances of being recognized as a topical authority.
Returning to the basketball analogy, this approach involves identifying and addressing areas where competitors have overlooked specific aspects of the game.
The final customizable feature of this script allows you to isolate sitemaps by category. While this method isn’t perfect since it doesn’t involve crawling the actual pages, it is a valuable starting point.
By introducing a keyword into the filter_term variable, you can limit the output to pages that contain the keyword either in their URL path or in their top keyword. This enables you to analyze the publication frequency for different topics.
For instance, if you want to examine a competitor’s publication frequency on pages solely related to conversion rate optimization (CRO), you can set the filter_term to “CRO.”
This will provide insights into the frequency with which they publish content on this specific topic.

Let’s rerun the script:

As you can see, only one post has included “CRO” in its URL path or “top keyword.”
This filter is typically more effective for larger websites, where it can accurately gauge the publishing velocity of specific keywords.
Key takeaways
This article explores the pivotal role of analyzing competitors’ content publishing patterns in semantic SEO. You can gain invaluable insights into your competitors’ strategies using the Python script we’ve demonstrated.
Understanding content velocity
- The script enables users to measure competitors’ content publishing frequency and focus, offering insights into their topical authority and areas of emphasis.
- This knowledge is invaluable for adjusting one’s content strategy to align with successful practices or find unique niches.
Identifying micro pockets of content
- By examining specific areas within competitors’ content, the script helps discover under-explored niches, presenting opportunities to establish topical authority in less contested domains.
Benchmarking and self-analysis
- Comparing one’s content strategy against competitors and analyzing one’s own site through the same lens is critical for maintaining competitiveness and understanding one’s standing in the industry.
Integrating with traffic analysis tools
- The script’s ability to combine sitemap data with traffic analytics from tools like Ahrefs provides a deeper understanding of the impact of content strategies on web traffic and SEO performance.
Long-term content management
- The script assists in identifying content that needs updating, ensuring that high-performing pages remain relevant and effective.
However, it’s essential to recognize the limitations of this script.
- It may struggle with complex sitemaps of extensive websites and doesn’t fully capture the nature of the content on each page.
- It relies on external traffic data, which may not be comprehensive.
- “Last Modified” doesn’t allow us to differentiate between updated and newly created content.
Despite these limitations, the script offers a powerful starting point to refine your SEO strategies in a dynamic digital landscape.