
Here’s how to check memory usage in Linux command to check which process is taking more memory in Linux. You can retrieve Linux memory usage by process in human readable format.
Command to monitor memory usage in Ubuntu
There are several commands which can be used to check memory usage of particular process in Linux Ubuntu.
We learn about 3 such commands:
Using top Command to Show Memory Usage in Mb
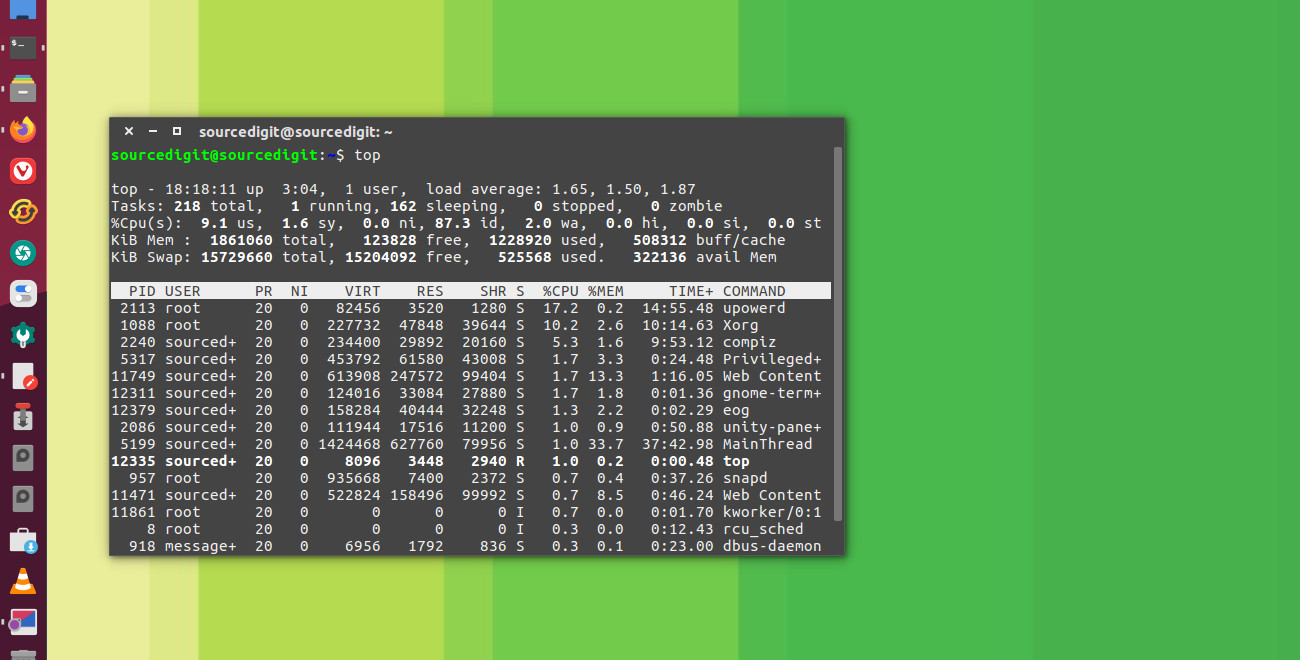
The Linux top command is used to display Linux processes. It shows a dynamic real-time view of a running system processes.
It can also be used to display system summary information as well as a list of processes or threads currently being managed by the Linux kernel.
When executed for the first time, you’ll see the following elements on the main top screen:
- Summary Area
- Fields/Columns Header
- Task Area.
The main top screen displays “TASK and CPU States” in minimum of two lines.
- Line 1 shows total tasks or threads, depending on the state of the Threads-mode toggle. That total is further classified as: running; sleeping; stopped; zombie.
- Line 2 shows CPU state percentages based on the interval since the last refresh.
The most important data displayed by top is the memory usage.
The three most important data to read are:
- %CPU — CPU Usage The task’s share of the elapsed CPU time since the last screen update, expressed as a percentage of total CPU time.
- %MEM — Memory Usage (RES) A task’s currently used share of available physical memory.
- S — Process Status The status of the task which can be one of:
- D = uninterruptible sleep
- R = running
- S = sleeping
- T = stopped by job control signal
- t = stopped by debugger during trace
- Z = zombie
When the physical memory is displayed, the percentage represents the scaled values in the following order:
- KiB = kibibyte = 1024 bytes
- MiB = mebibyte = 1024 KiB = 1,048,576 bytes
- GiB = gibibyte = 1024 MiB = 1,073,741,824 bytes
- TiB = tebibyte = 1024 GiB = 1,099,511,627,776 bytes
- PiB = pebibyte = 1024 TiB = 1,125,899,906,842,624 bytes
- EiB = exbibyte = 1024 PiB = 1,152,921,504,606,846,976 bytes
Using free Command to Show Memory Usage
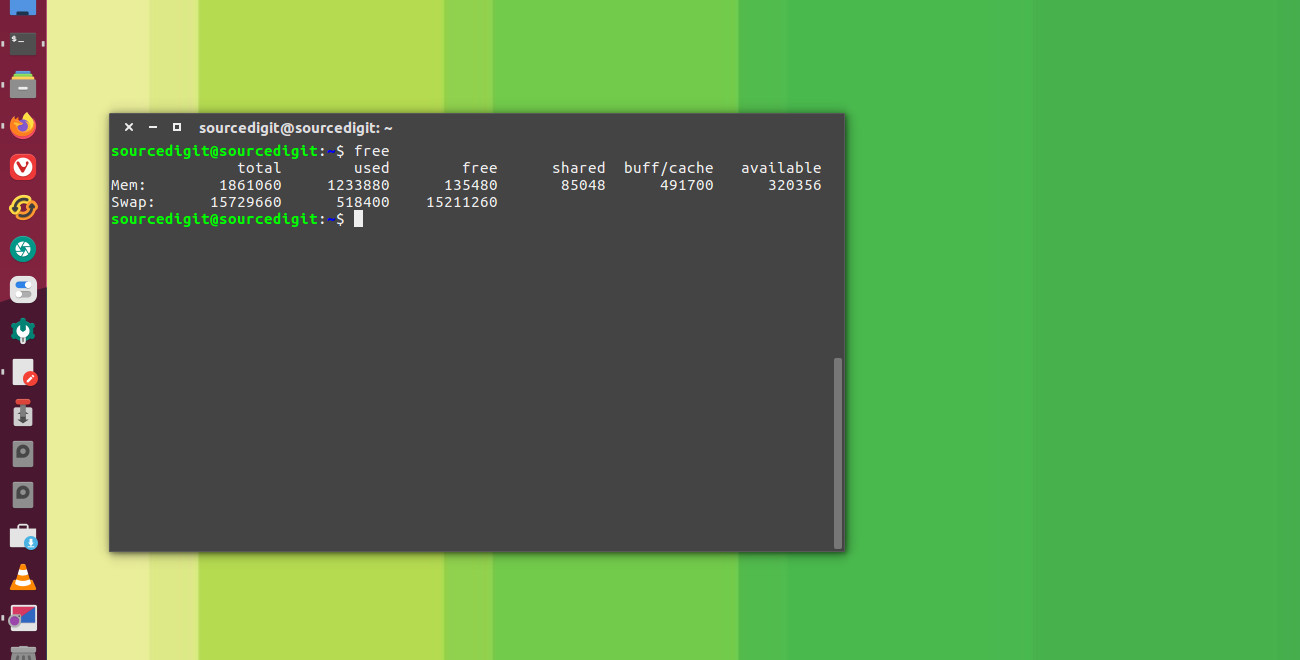
The free command displays the total amount of free and used physical and swap memory in the system, as well as the buffers and caches used by the kernel.
The information is gathered by parsing /proc/meminfo. The following columns are displayed:
- total Total installed memory (MemTotal and SwapTotal in /proc/meminfo)
- used Used memory (calculated as total – free – buffers – cache)
- free Unused memory (MemFree and SwapFree in /proc/meminfo)
- shared Memory used (mostly) by tmpfs (Shmem in /proc/meminfo, available on kernels 2.6.32, displayed as zero if not available)
- buffers Memory used by kernel buffers (Buffers in /proc/meminfo)
- cache Memory used by the page cache and slabs (Cached and Slab in /proc/meminfo)
- buff/cache Sum of buffers and cache
- available Estimation of how much memory is available for starting new applications, without swapping.
NOTE: To display and read the memory data in human-readable format, you can use the -h command option.
The -h or –human command option will show all output fields automatically scaled to shortest three digit unit and display the units in the following units.
- B = bytes
- K = kilos
- M = megas
- G = gigas
- T = teras
Using Ps Command to Show Memory Usage in Mb
You can use the ps command to check memory usage of all the processes on Linux in human readable format, in Mb. Using the following ps command you can check memory usage in percentage:
$ ps -o pid,user,%mem,command ax | sort -b -k3 -r